
Why do we analyze social media data?
The ubiquity of social media has turned these platforms into goldmines of data. By analyzing social media data, researchers, businesses, and policymakers can extract valuable insights from a wide range of subjects. Here are some compelling reasons underscored by real-world examples:
Understanding societal trends and movements
A classic example of this is the Arab Spring of 2010-2012. Through analyzing tweets, Facebook posts, and other online discourse, researchers could track the spread of dissent, identify key influencers, and understand the underlying grievances driving the protests.
A social media report providing this kind of analysis offers a real-time pulse of societal sentiments, helping stakeholders gauge public opinion and predict potential shifts.
Branding and consumer sentiment analysis
Businesses today rely heavily on social media feedback to understand their consumers. For instance, a beverage company launching a new drink might monitor Twitter reactions to gauge initial public sentiment.
Negative feedback about taste can prompt recipe adjustments, while positive feedback on packaging might lead to its design being incorporated into other product lines.
Public health surveillance
During the COVID-19 pandemic, health organizations monitored social media to track public sentiments on vaccinations, lockdowns, and health measures.
By doing so, they could understand common misconceptions, fears, and compliance levels, tailoring their communication strategies accordingly.
Crisis monitoring and response
Natural disasters, political crises, or public incidents often generate a flurry of social media activity. Analyzing this data can help local authorities and humanitarian organizations pinpoint affected areas, understand the scale of the crisis, and deploy resources efficiently.
For instance, during Hurricane Harvey in 2017, emergency responders utilized social media data to locate and rescue stranded individuals based on their posts and location tags.

ATLAS.ti for social media research
Qualitative analysis software is a natural fit for data taken from digital platforms. Data organization and coding are integral parts of every qualitative research project, but we’ll use this section to describe two tools that are particularly useful for social media research.
Sentiment Analysis
Sentiment analysis is a powerful tool for gauging public opinion on a vast scale. In social media, where millions express their feelings daily, it provides a systematic way to classify and interpret these emotions. By determining whether the sentiment of a post is positive, negative, or neutral, researchers can track shifts in public sentiment, be it for a product launch, a political event, or a societal issue.
This real-time feedback is invaluable. It enables businesses to adapt their strategies, policymakers to address public concerns, and researchers to understand the prevailing mood of a digital audience. This nuanced understanding generates useful insights for crafting responsive and effective strategies across various sectors.
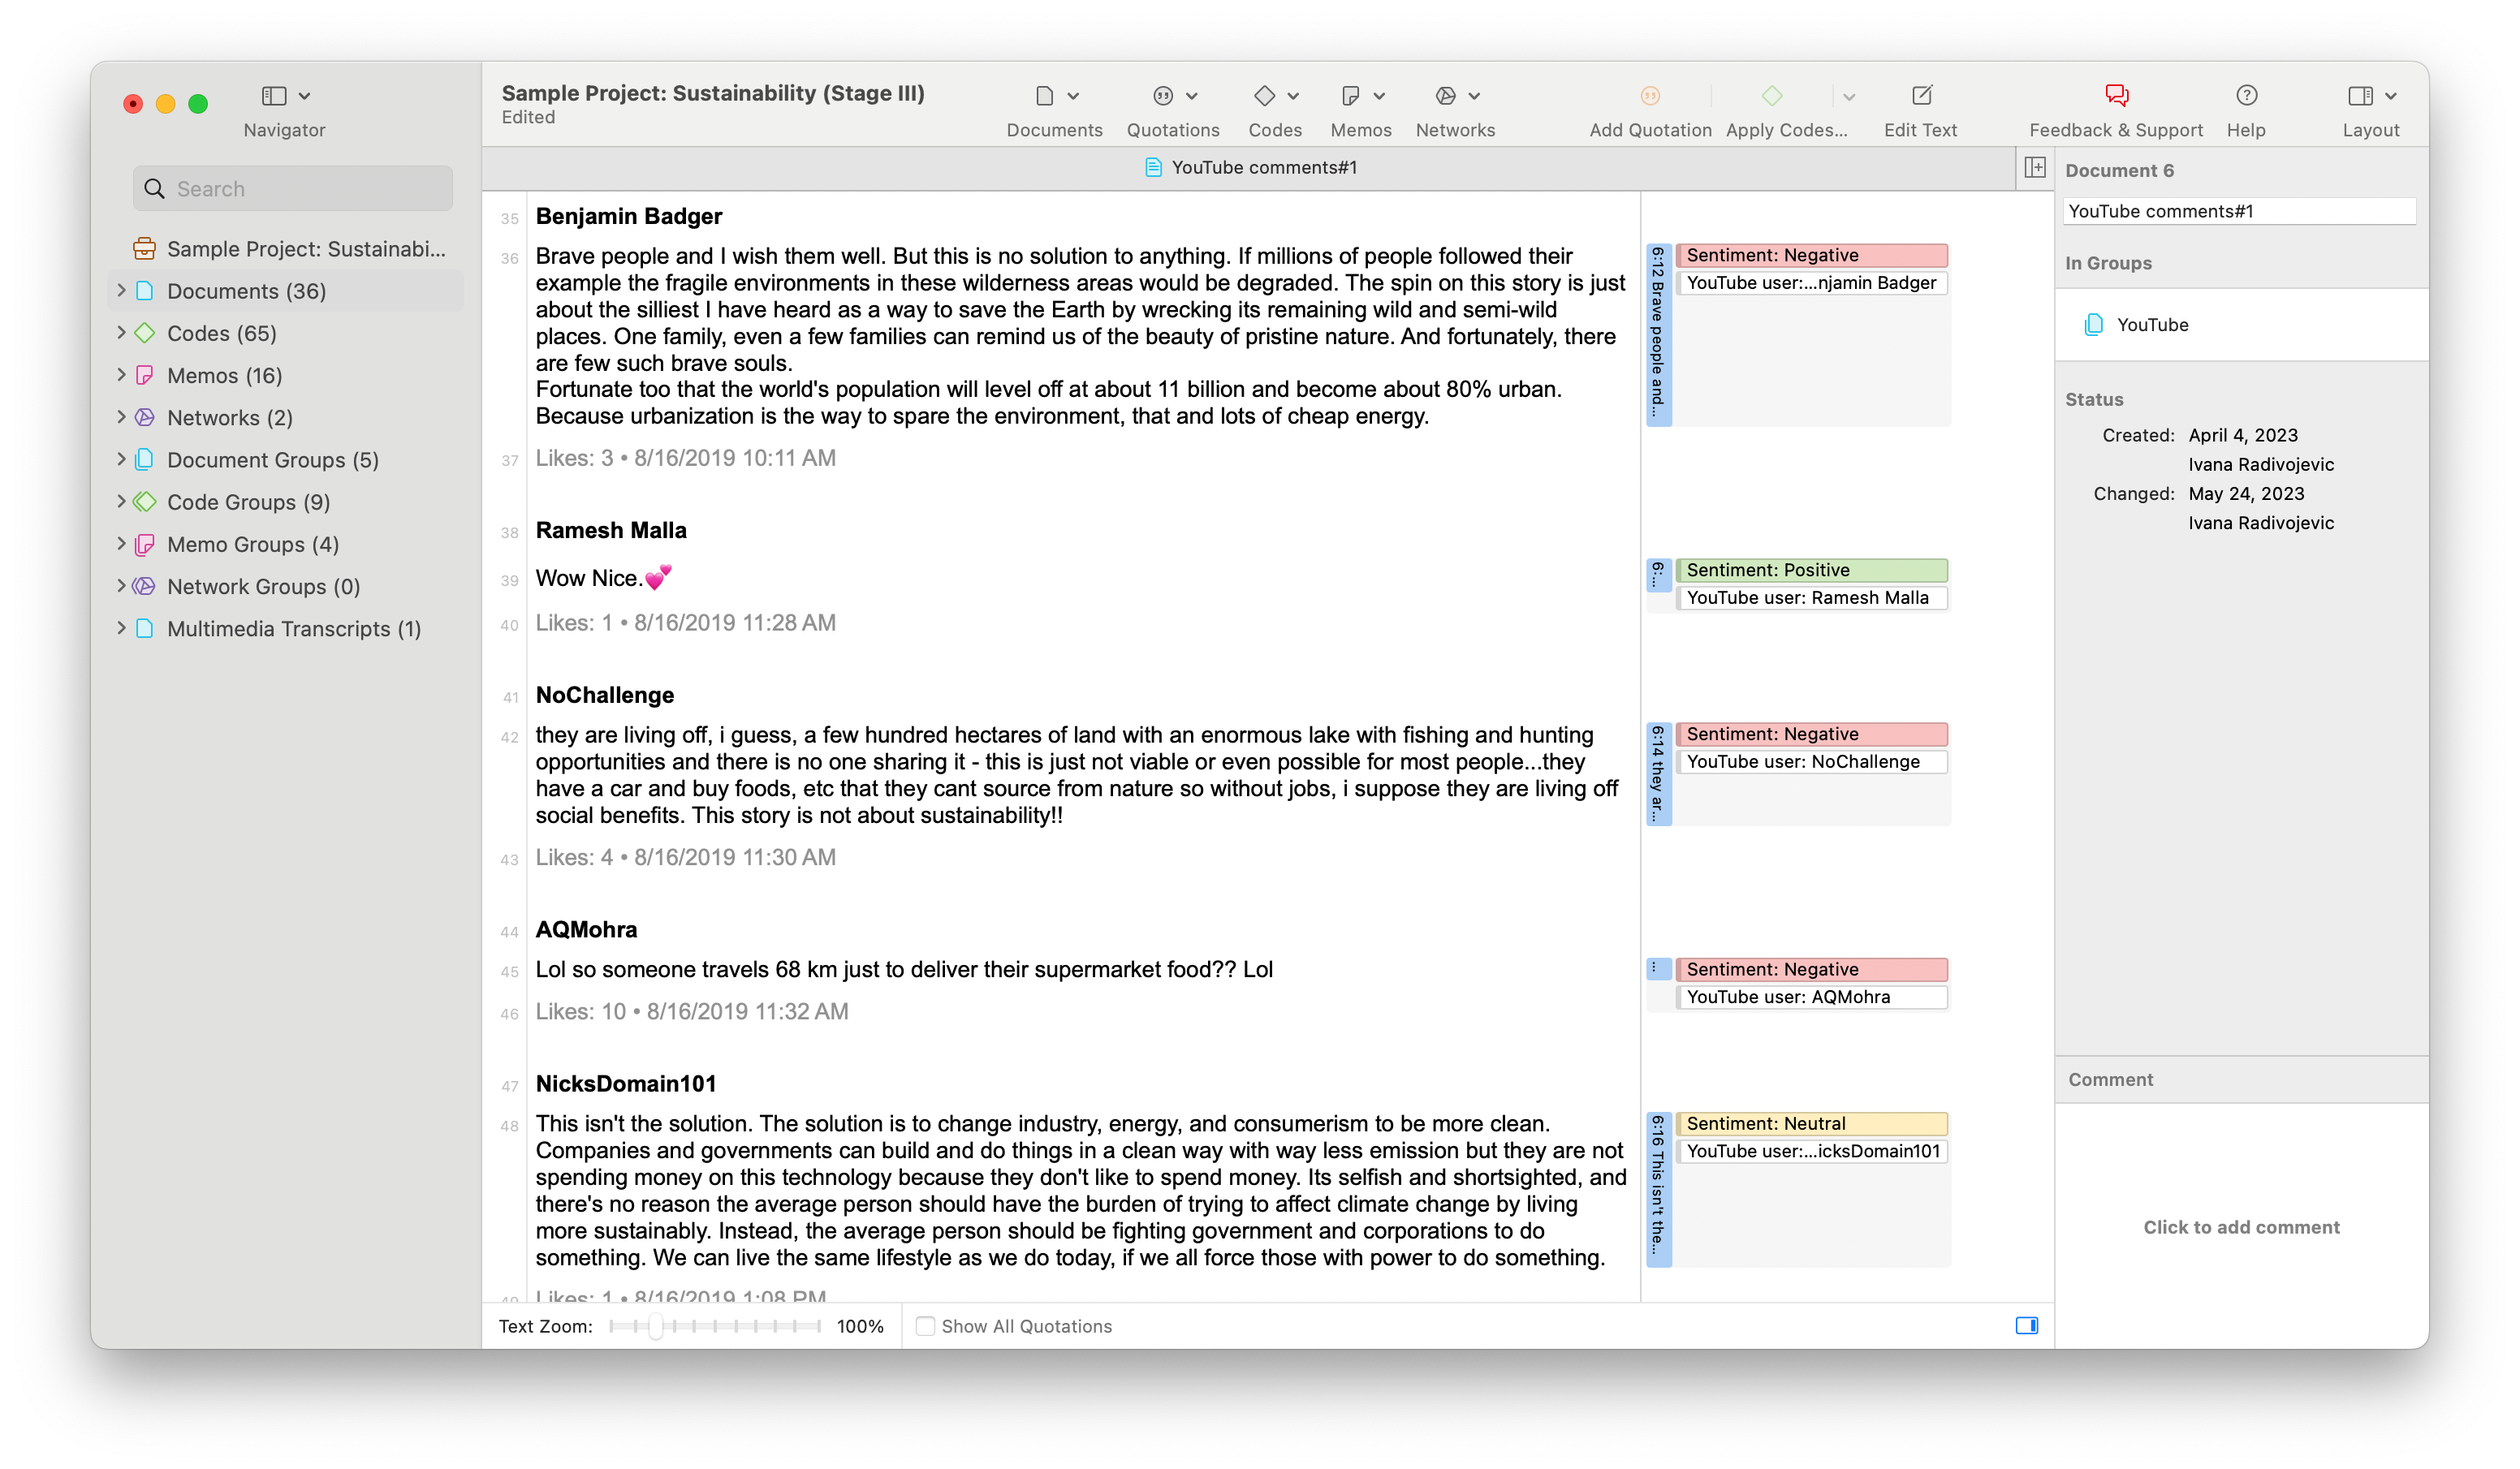
ATLAS.ti’s Sentiment Analysis tool relies on machine learning to examine textual data and determine the sentiment being expressed. Rather than painstakingly examining each comment or post manually, Sentiment Analysis can process large datasets quickly and efficiently to apply sentiment codes to data segments for subsequent analysis.
Word Frequencies
Social media content analysis emphasizes the occurrence of words and phrases that commonly appear in the data. Word clouds and word lists offer a visual representation of the frequency of words used within a given dataset, effectively highlighting the most discussed topics or terms in social media content.
For researchers, these tools simplify vast amounts of textual data, making patterns and trends immediately recognizable. In the context of social media, where vast swathes of text can be overwhelming, word clouds and lists distill key themes, allowing for quicker insights. By spotlighting recurrent words or phrases, researchers can swiftly identify predominant topics of conversation, ensuring they don’t overlook important areas of discussion in their analyses.
The Word Frequencies tool in ATLAS.ti is useful for creating these visualizations. This tool not only looks at what words are used, but aggregates words together by their base forms (e.g., “enjoy” and “enjoys” are treated as one unit) and allows you to filter words by part of speech. You can also narrow the analysis in Word Frequencies to certain documents, quotations, or even codes to process the data most relevant to your research.
Putting it all together
Using ATLAS.ti tools in tandem is great for generating insightful analysis for your social media report. After applying Sentiment Analysis to a set of YouTube comments in the screenshot above, we used Word Frequencies to only look at the positive comments. After specifying what parts of speech to include in the analysis, the result is a word cloud that displays the most commonly occurring words among positive comments, which will likely differ from a similar visualization of an analysis of negative comments or even neutral comments. With ATLAS.ti, creating these different visualizations is quick and easy, so you can focus on analyzing similarities and differences across the different subsets of data