
What is an example of turning qualitative data into quantitative data?
What is an example of turning qualitative data into quantitative data?
Let’s look at a hypothetical research project that aims to understand customer satisfaction with a newly launched mobile application to illustrate the conversion from qualitative to quantitative data. In this scenario, researchers conduct qualitative research by conducting interviews with users and asking them open-ended questions such as “What do you like about the app?” and “What improvements would you suggest?” Additionally, they gather text-based reviews from various online platforms where users can freely express their opinions about the app.
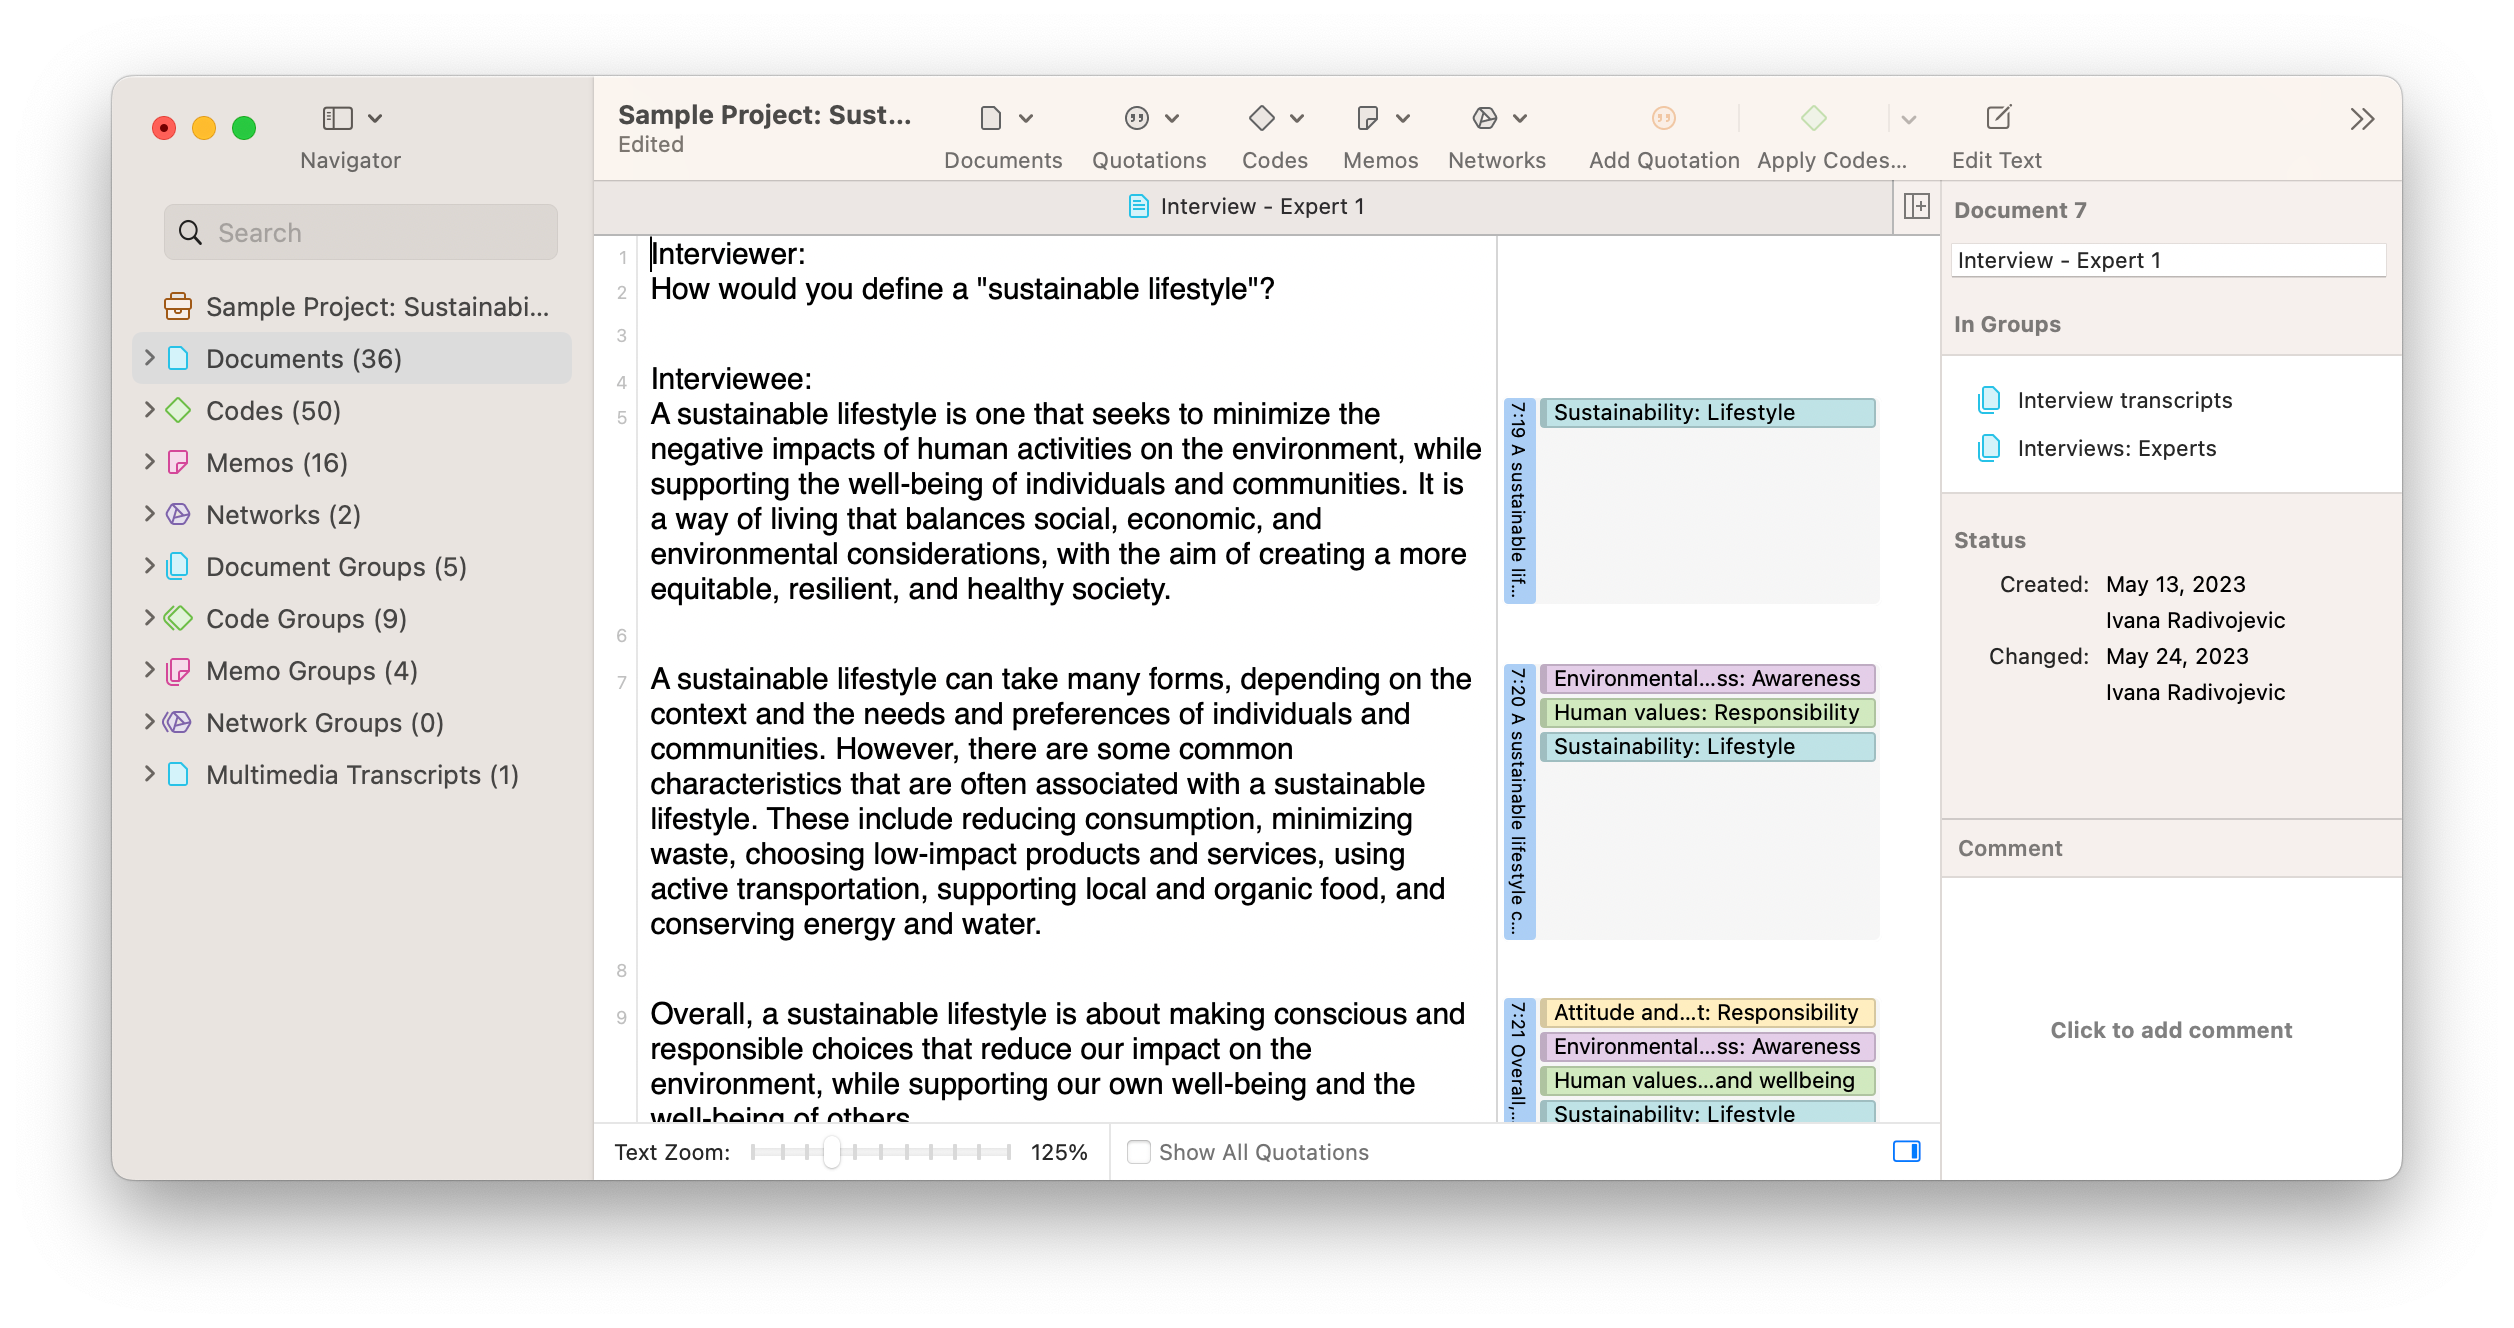
Once qualitative research methods have collected the necessary data, the researchers begin the process of coding. This involves reviewing the interview transcripts and text reviews, then identifying recurring themes or phrases. For instance, phrases like “user-friendly interface,” “frequent crashes,” or “helpful customer support” could be extracted and assigned specific codes.
After coding, the next step is to group these codes into broader categories or themes. These might include categories like “Usability,” “Technical Issues,” and “Customer Support.” Qualitative analysis can then look at these categories to generate an understanding of the key themes in the data. At this stage, researchers can also count the frequency with which each code or category appears in the data. For example, if the category “Usability” is mentioned 40 times across all interviews and reviews, and “Technical Issues” is mentioned 30 times, these numbers begin to form quantitative data points that can be analyzed statistically.
Next, researchers can now perform various analyses to answer specific questions. For example, they might use statistical tests to determine if the frequency of mentions of “Technical Issues” is statistically significant when compared to other categories. They may also correlate these quantitative results with other points of interest, such as net promoter scores, app ratings, or user engagement metrics, to provide a more holistic understanding of customer satisfaction.
However, the qualitative insights shouldn’t be overlooked even as the data is being quantified. The qualitative data offer the depth and context that make the quantitative results meaningful. For instance, while a quantitative approach to analysis can tell you “what” the issues are and how often they occur, a qualitative approach can tell you “why” these issues matter to the users. In our example, knowing that “Technical Issues” were mentioned 30 times is valuable, but understanding the frustration or inconvenience caused by these issues provides a fuller picture.
By integrating both qualitative narratives and quantitative measurements, researchers can provide a richer, more comprehensive analysis of customer satisfaction with the mobile application. In this manner, the converted quantitative data serves to enhance and validate the findings from the qualitative data, rather than replace them.