How to quantify qualitative data
How to quantify qualitative data
When you want to turn qualitative data into quantitative data, there is a series of carefully planned steps that should be aligned with the objectives of your research. It starts with a clear understanding of your research question and how quantitative analysis can complement the qualitative insights you’ve gained.
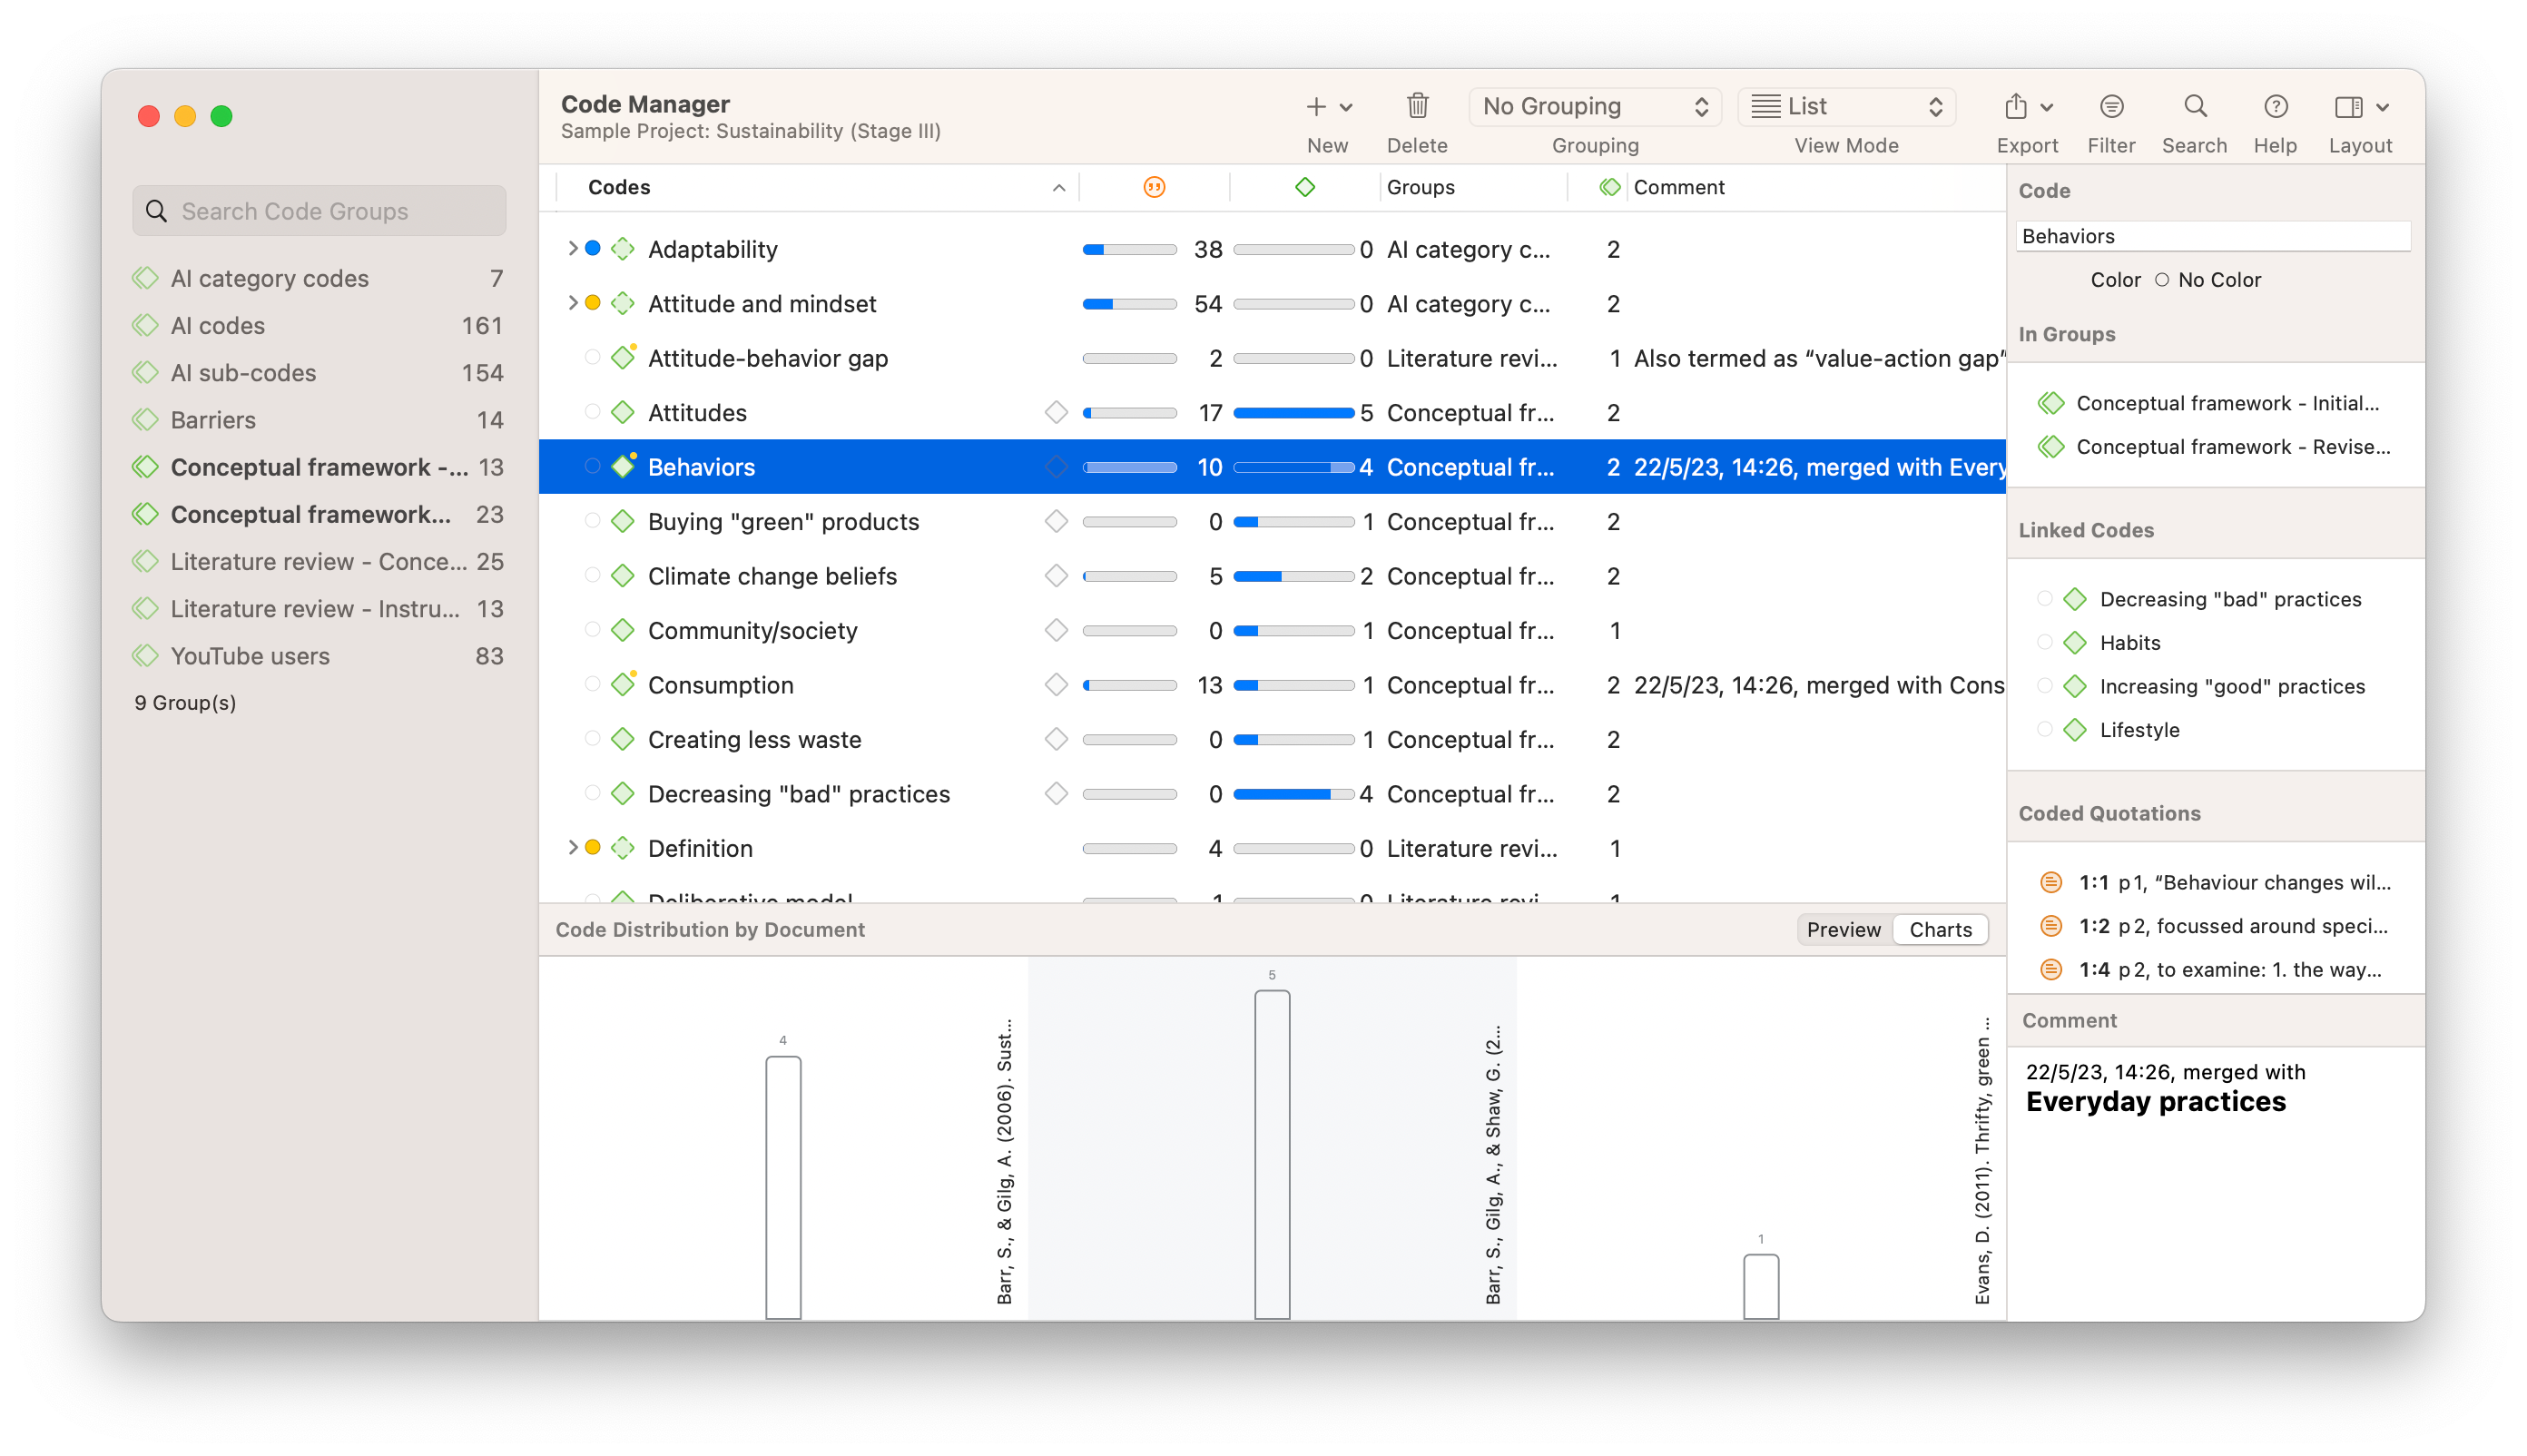
The first stage often involves coding, a methodical process that translates textual or visual information into a format that can be counted and categorized. Imagine you’re studying evaluations from a set of online product reviews. You could start by reading through the reviews and identifying recurring themes, ideas, or expressions. These could be things like “easy to use,” “poor quality,” or “excellent customer service.” Each of these recurring elements would be assigned a specific code.
But coding is not just about picking out phrases; it also requires interpreting the context in which they are used. For example, the phrase “easy to use” may be coded under a theme such as “usability,” but the context and tone should also be considered with respect to whether this is being mentioned as a positive or a negative aspect by the reviewer.
Once the coding process is complete, the next stage is often grouping or clustering these codes into broader categories or themes. The aggregation serves to simplify the collected information into more manageable sets. For instance, if you’ve coded phrases like “easy to use,” “intuitive design,” and “simple interface,” these could all be grouped under a broader category like “Usability.”
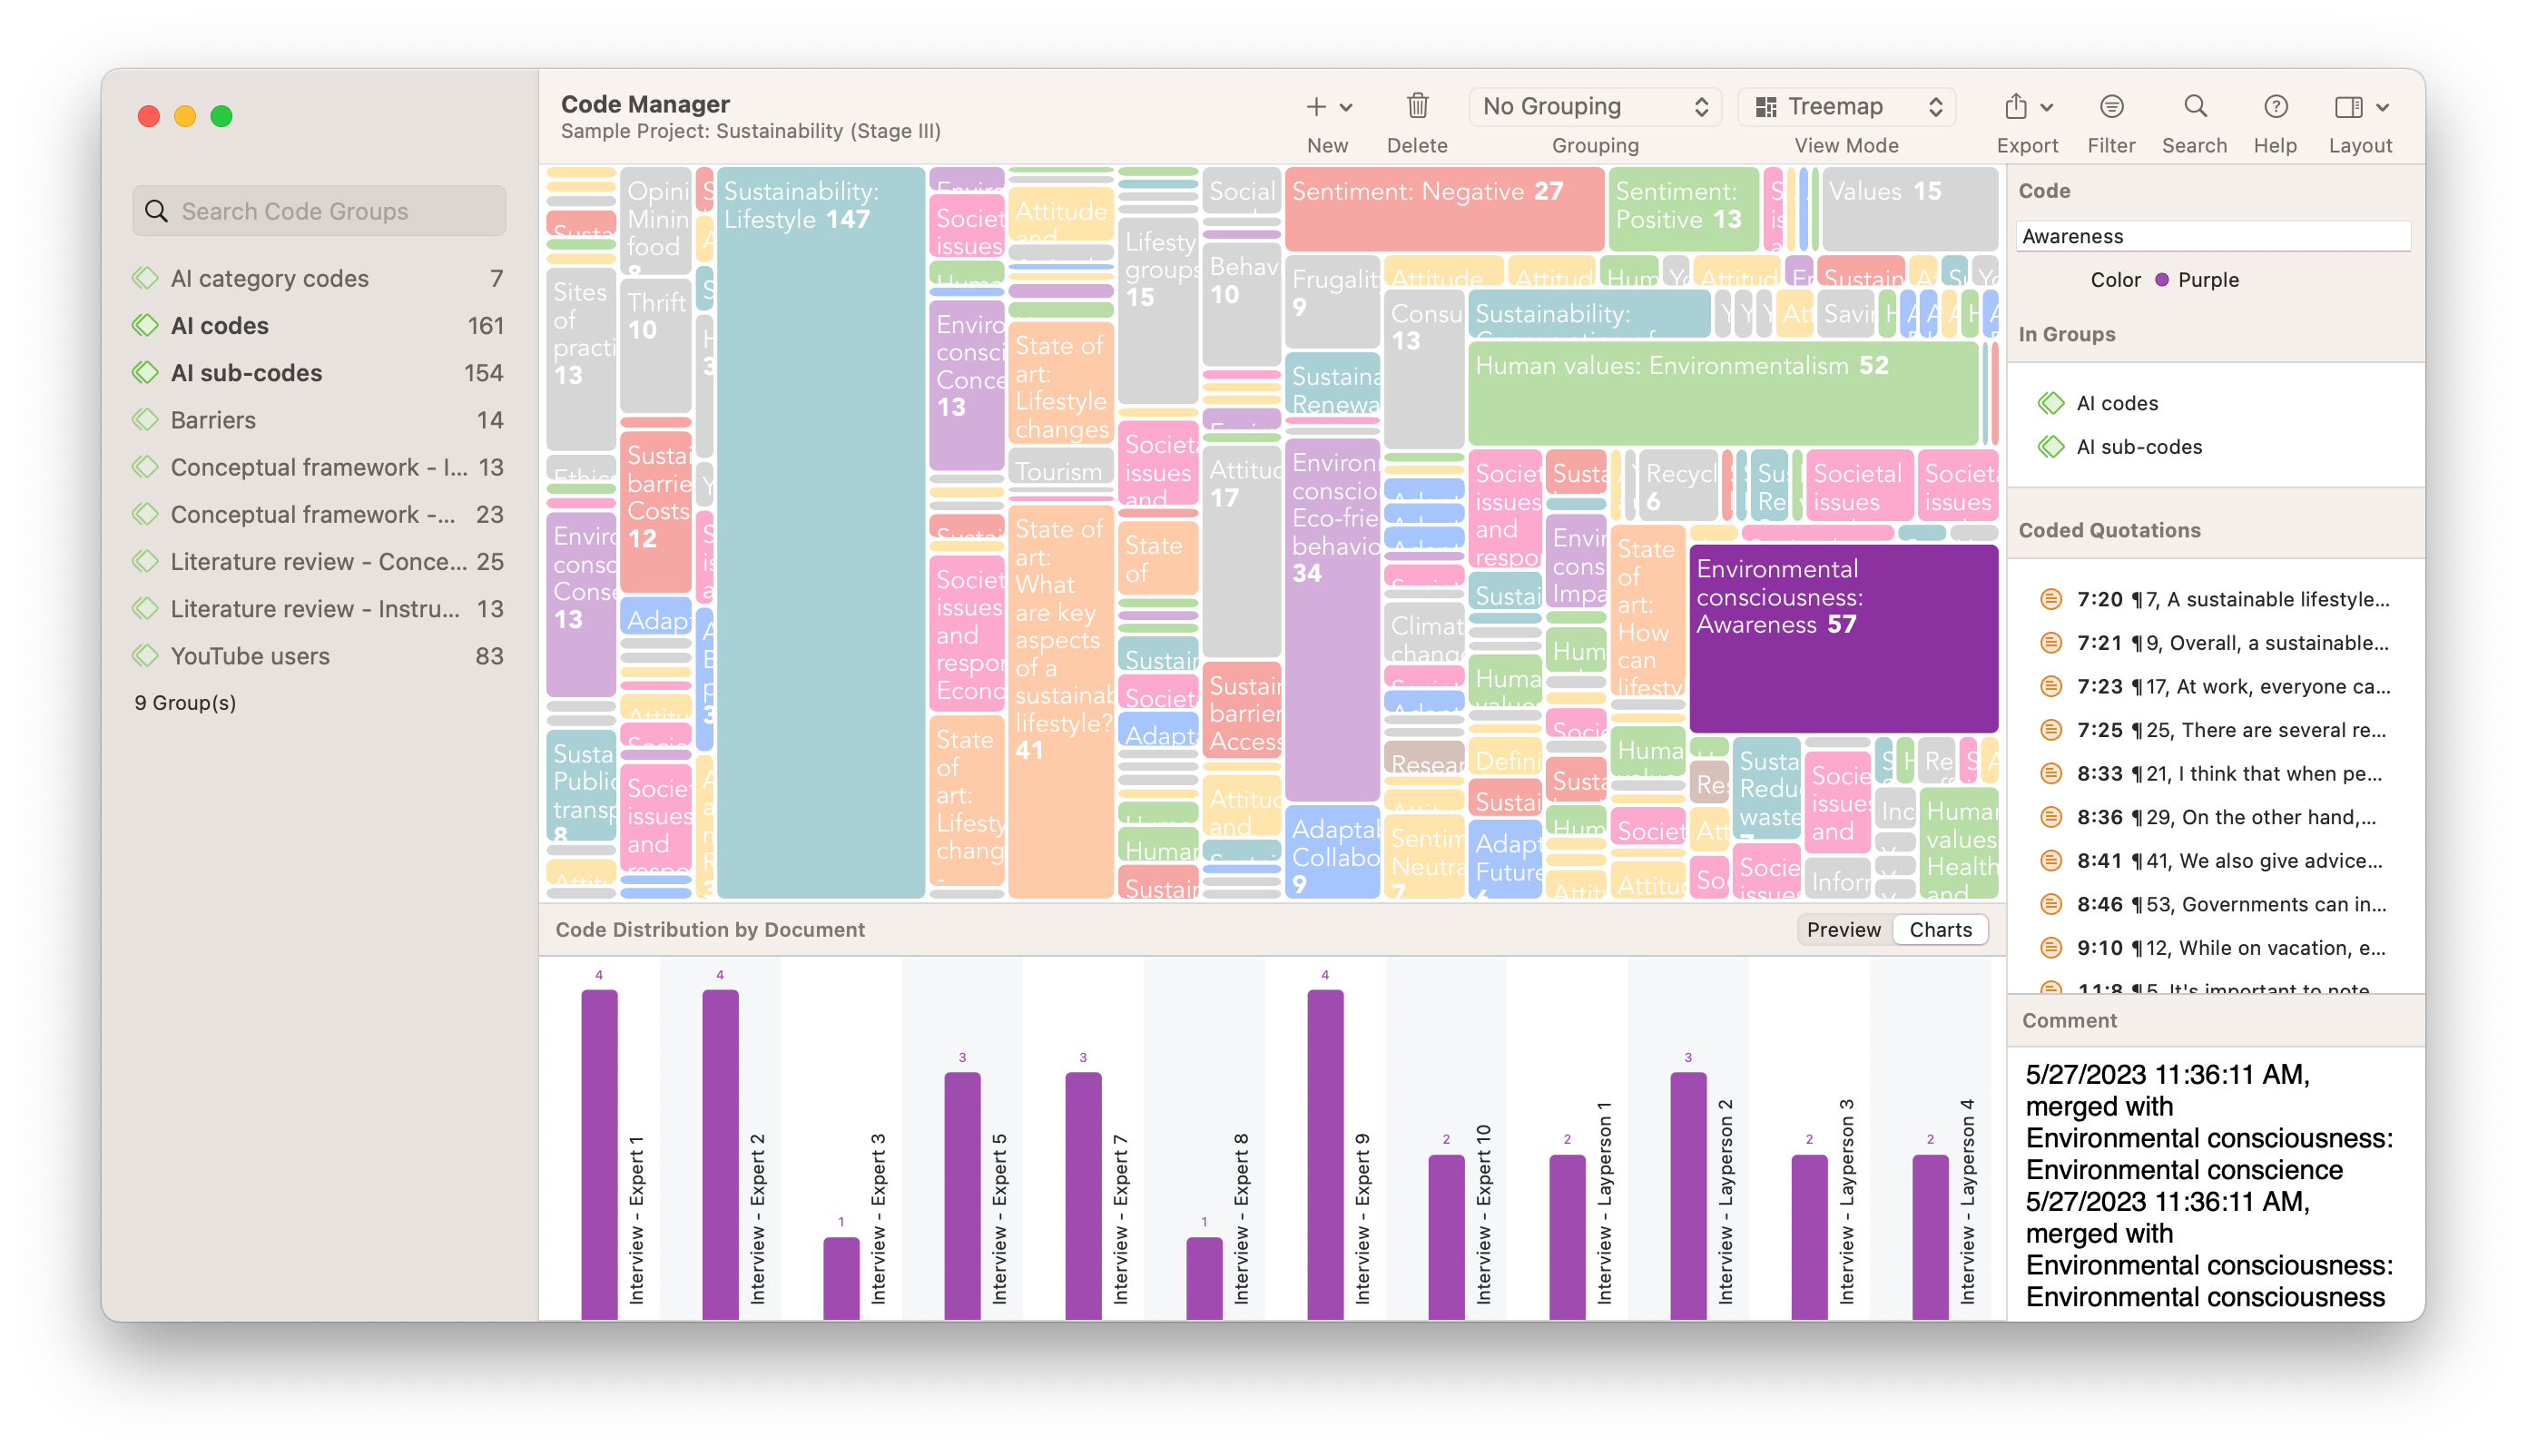
After grouping, you can then quantify your data by counting the frequency of these codes or themes. In a simplistic form, this could mean tallying how many times each code appears across your dataset. This numerical representation allows you to employ statistical methods to your findings, perhaps comparing them to other quantitative metrics you’ve gathered, such as numerical ratings or the time spent using a product.
In addition, qualitative data analysis software, such as ATLAS.ti, allows you to export your entire coded project into a format that can be imported into statistical analysis software to run regressions and other quantitative analyses.
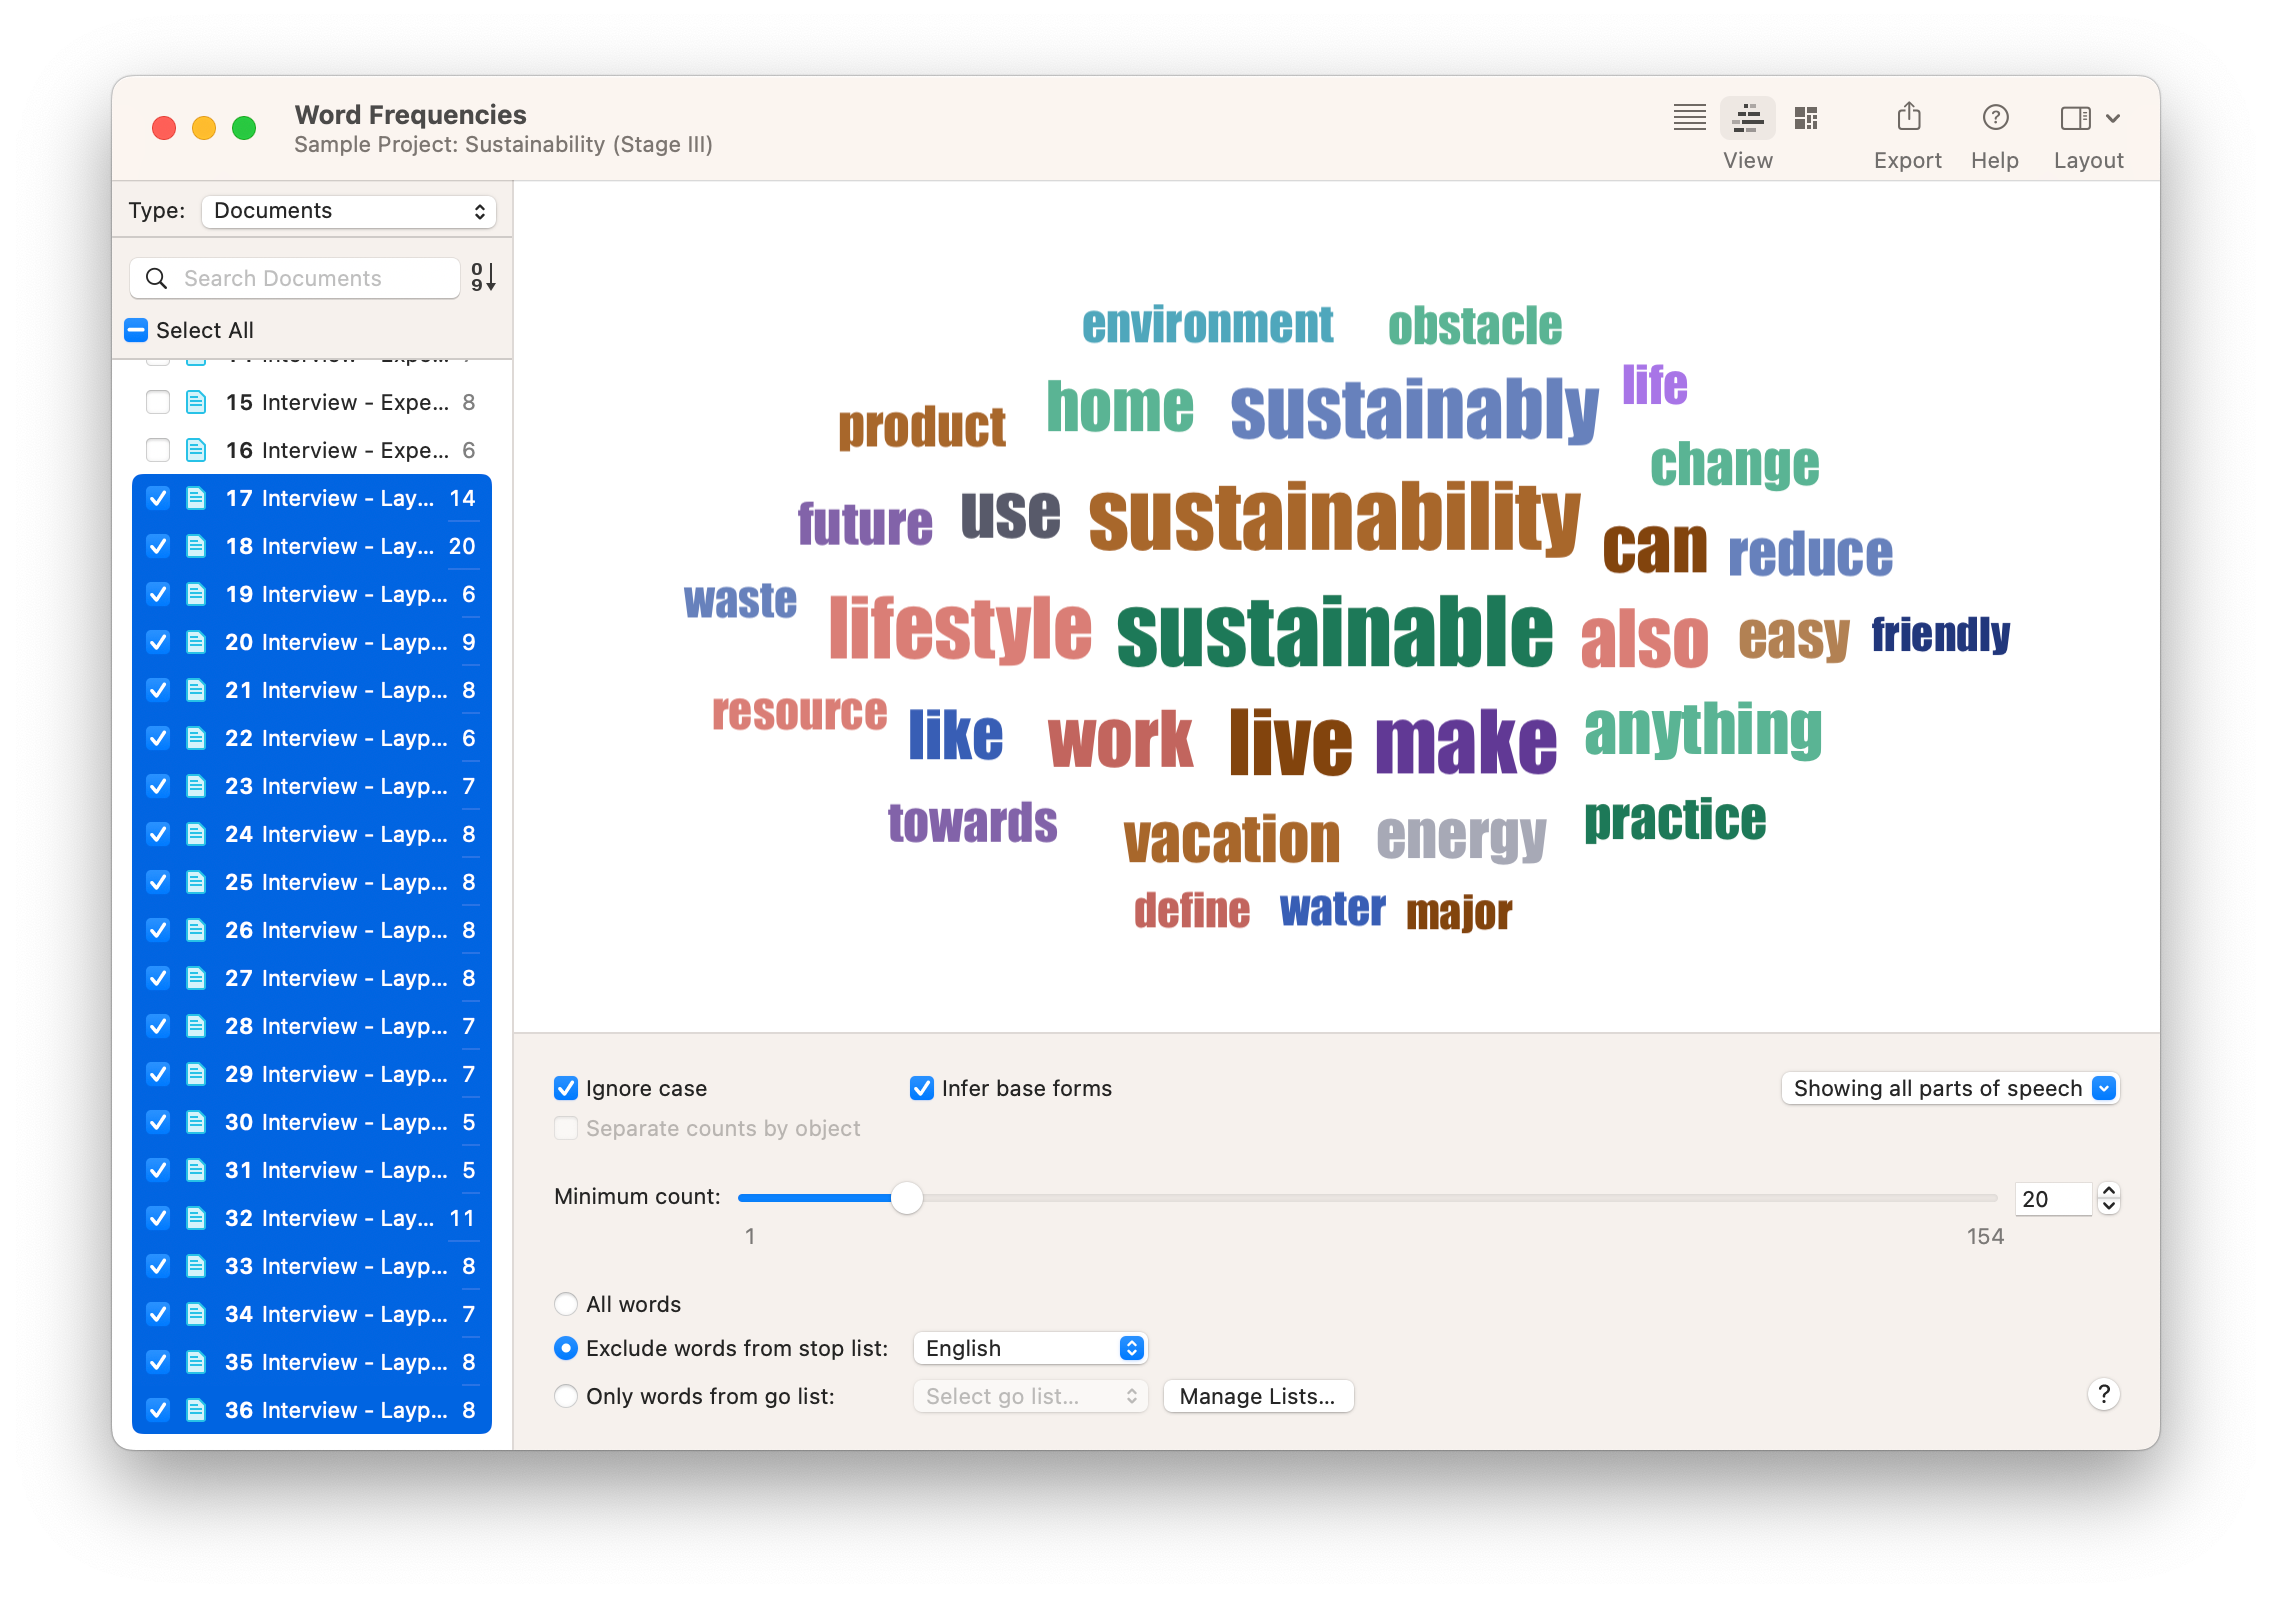
One popular method for this kind of analysis is content analysis, where the frequency of certain words, phrases, or codes can be statistically examined in visualizations like word clouds. Advanced software can also assist in this process, offering tools that can perform automated coding and thematic analysis on large datasets, although human oversight is generally recommended to ensure the qualitative nuances are not lost.
But remember, the process doesn’t end at the point of conversion. The quantitative data you generate should be viewed as a complement to your qualitative findings, not a replacement. Interpretation is the final step in this process. While quantitative data can provide a high-level view that makes it easier to identify trends or make comparisons, a qualitative analysis offers the nuanced context that gives these numbers meaning.